For the most part, linguists make assumptions about speech based on the acoustic information we get from the sounds made when speaking, as opposed to what our tongues are actually doing when we speak. We make plots and charts based on those sounds, then manipulate that information to visualize data in a way that is consistent with what the mouth is doing.
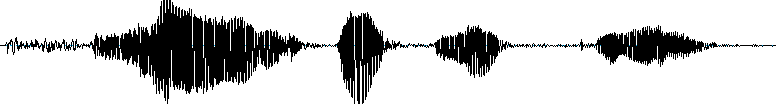
We can use this acoustic information to categorize sounds. For example, when we see certain acoustic characteristics, we can know whether a sound is a consonant or a vowel, or that it is a specific type of consonant or vowel. After all, we make the same judgments as speakers of a language when we hear a word: generally we only get acoustic information (along with a limited set of facial cues, such as lip rounding in sounds like “o” and the total closure of the mouth in sounds like “p,” “b,” and “m”) when we perceive speech. In the waveform below (a visualization of volume in speech), we can see that there are two consonants in red and two underlined vowels, just by the information we get about volume — consonants are formed with more closure, and therefore, less volume than vowels.
via the Aristotle University of Thessaloniki School of English
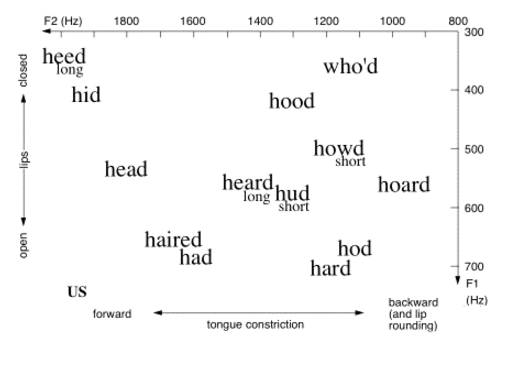
Vowels are a good example of how linguists use acoustic information to make judgments about how sounds are actually articulated. The following vowel plot is an attempt to show where vowels in each word are produced, where “F2” is an acoustic measure representing how front/back the vowel is produced, and “F1” is a measure of how high/low a vowel is produced. You can see (and feel, if you pronounce it out loud) that the vowel in “heed” is pronounced high and front in the mouth, whereas the vowel in “hod” is pronounced lower and further back.
Sometimes, though, acoustic information doesn’t tell us everything we need to know. An American “r” sound, as in both the beginning and the end of the word “rare,” will give us the same acoustic information no matter what. But if you look at “r” with ultrasound imaging, there are two very distinct ways of articulating that sound.
The first is what linguists call a “bunched r.” The ultrasound images below represent the tongue: the right side is near the tip of the tongue, the left side is the tongue root. Both are taken from Klein et al (2013).
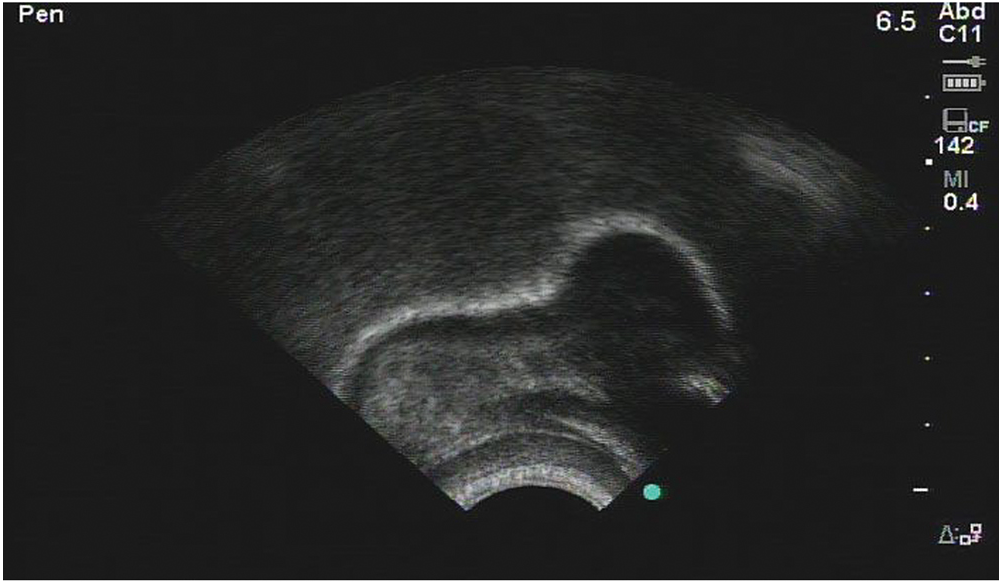
The second is what linguists call a “retroflex r” — the arrow is pointing to the tip of the tongue, which is curled backwards.
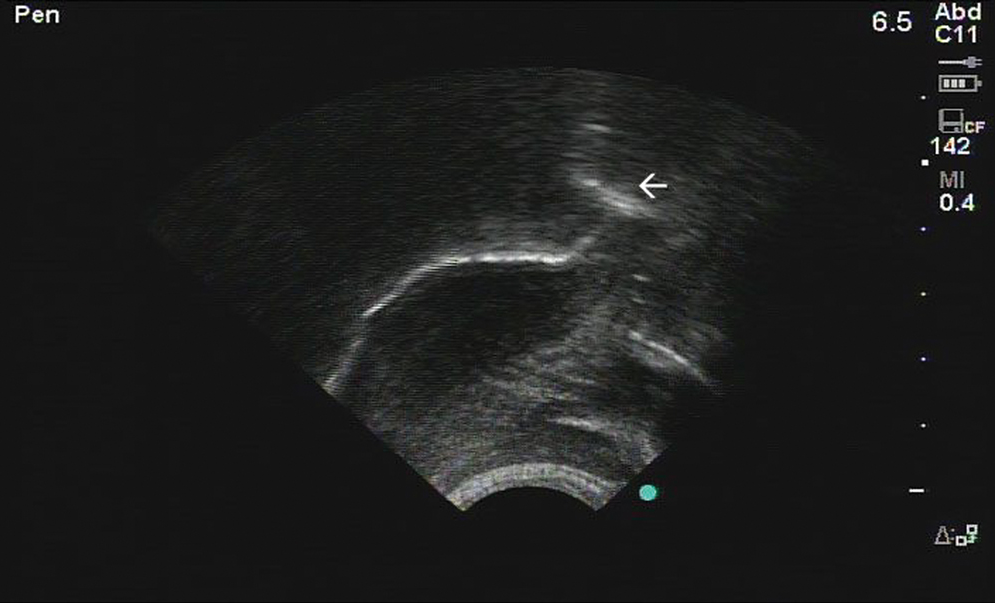
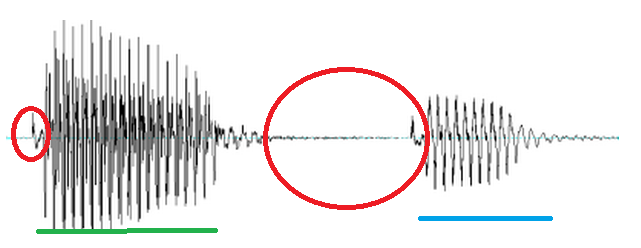
Despite two very different tongue shapes, the acoustic information for each looks almost identical, and there are no patterns of sex, region, class, ethnicity, or anything else that accounts for the differences in producing these sounds. Imaging techniques are the only way for linguists to know that some people produce bunched “r” and some people produce retroflex “r.” Both types of “r” are characterized by the dip in the purple line in the following spectrogram (which shows acoustic information, but we won’t get into the details in this post):
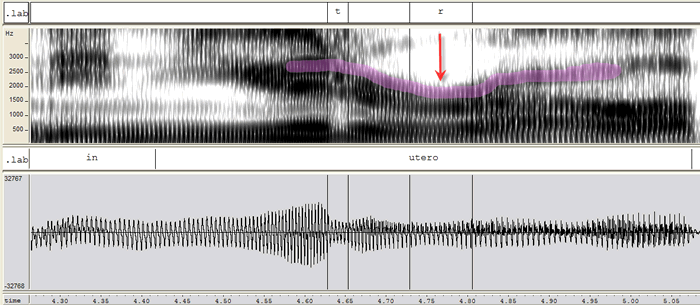
via Mark Lieberman on Language Log
Linguists use articulatory imaging to make heat maps of the movements of certain sounds and to look for specific features — the top right square below measures the amount of “tensing” in the vowel “a” in “ban” (without getting into it too much, the “a” sound in “ban” or “bad” tends to be more tensed in front of “m” or “n” — compare the vowel in “ban” and the vowel in “bad”).
via Chris Carignan’s website
For all of the recent technological improvements such as the ones above, however, imaging used to be much better. Linguists used to look at speech via x-rays, which provided an amazingly clear picture of speech. Those methods are no longer widespread, due to the hazards of exposure to radiation for the amount of time needed to get images of whole words. For non-medical reasons, that type of risk is not acceptable. Now, linguists tend to use ultrasound or MRI rather than x-rays.
Older images do exist, such as this last image here:
via Christine Ericsdotter’s website
You can see the muscles working in tandem: the lips, the hyoid bone at the larynx, the tongue, and the velum above the back of the tongue, notably. This image represents the beautifully complex process that is speech, and even if we could get all the information that we need to answer specific questions about language from acoustic data, speech imaging gives us an insight and appreciation for speech that a waveform just doesn’t.
